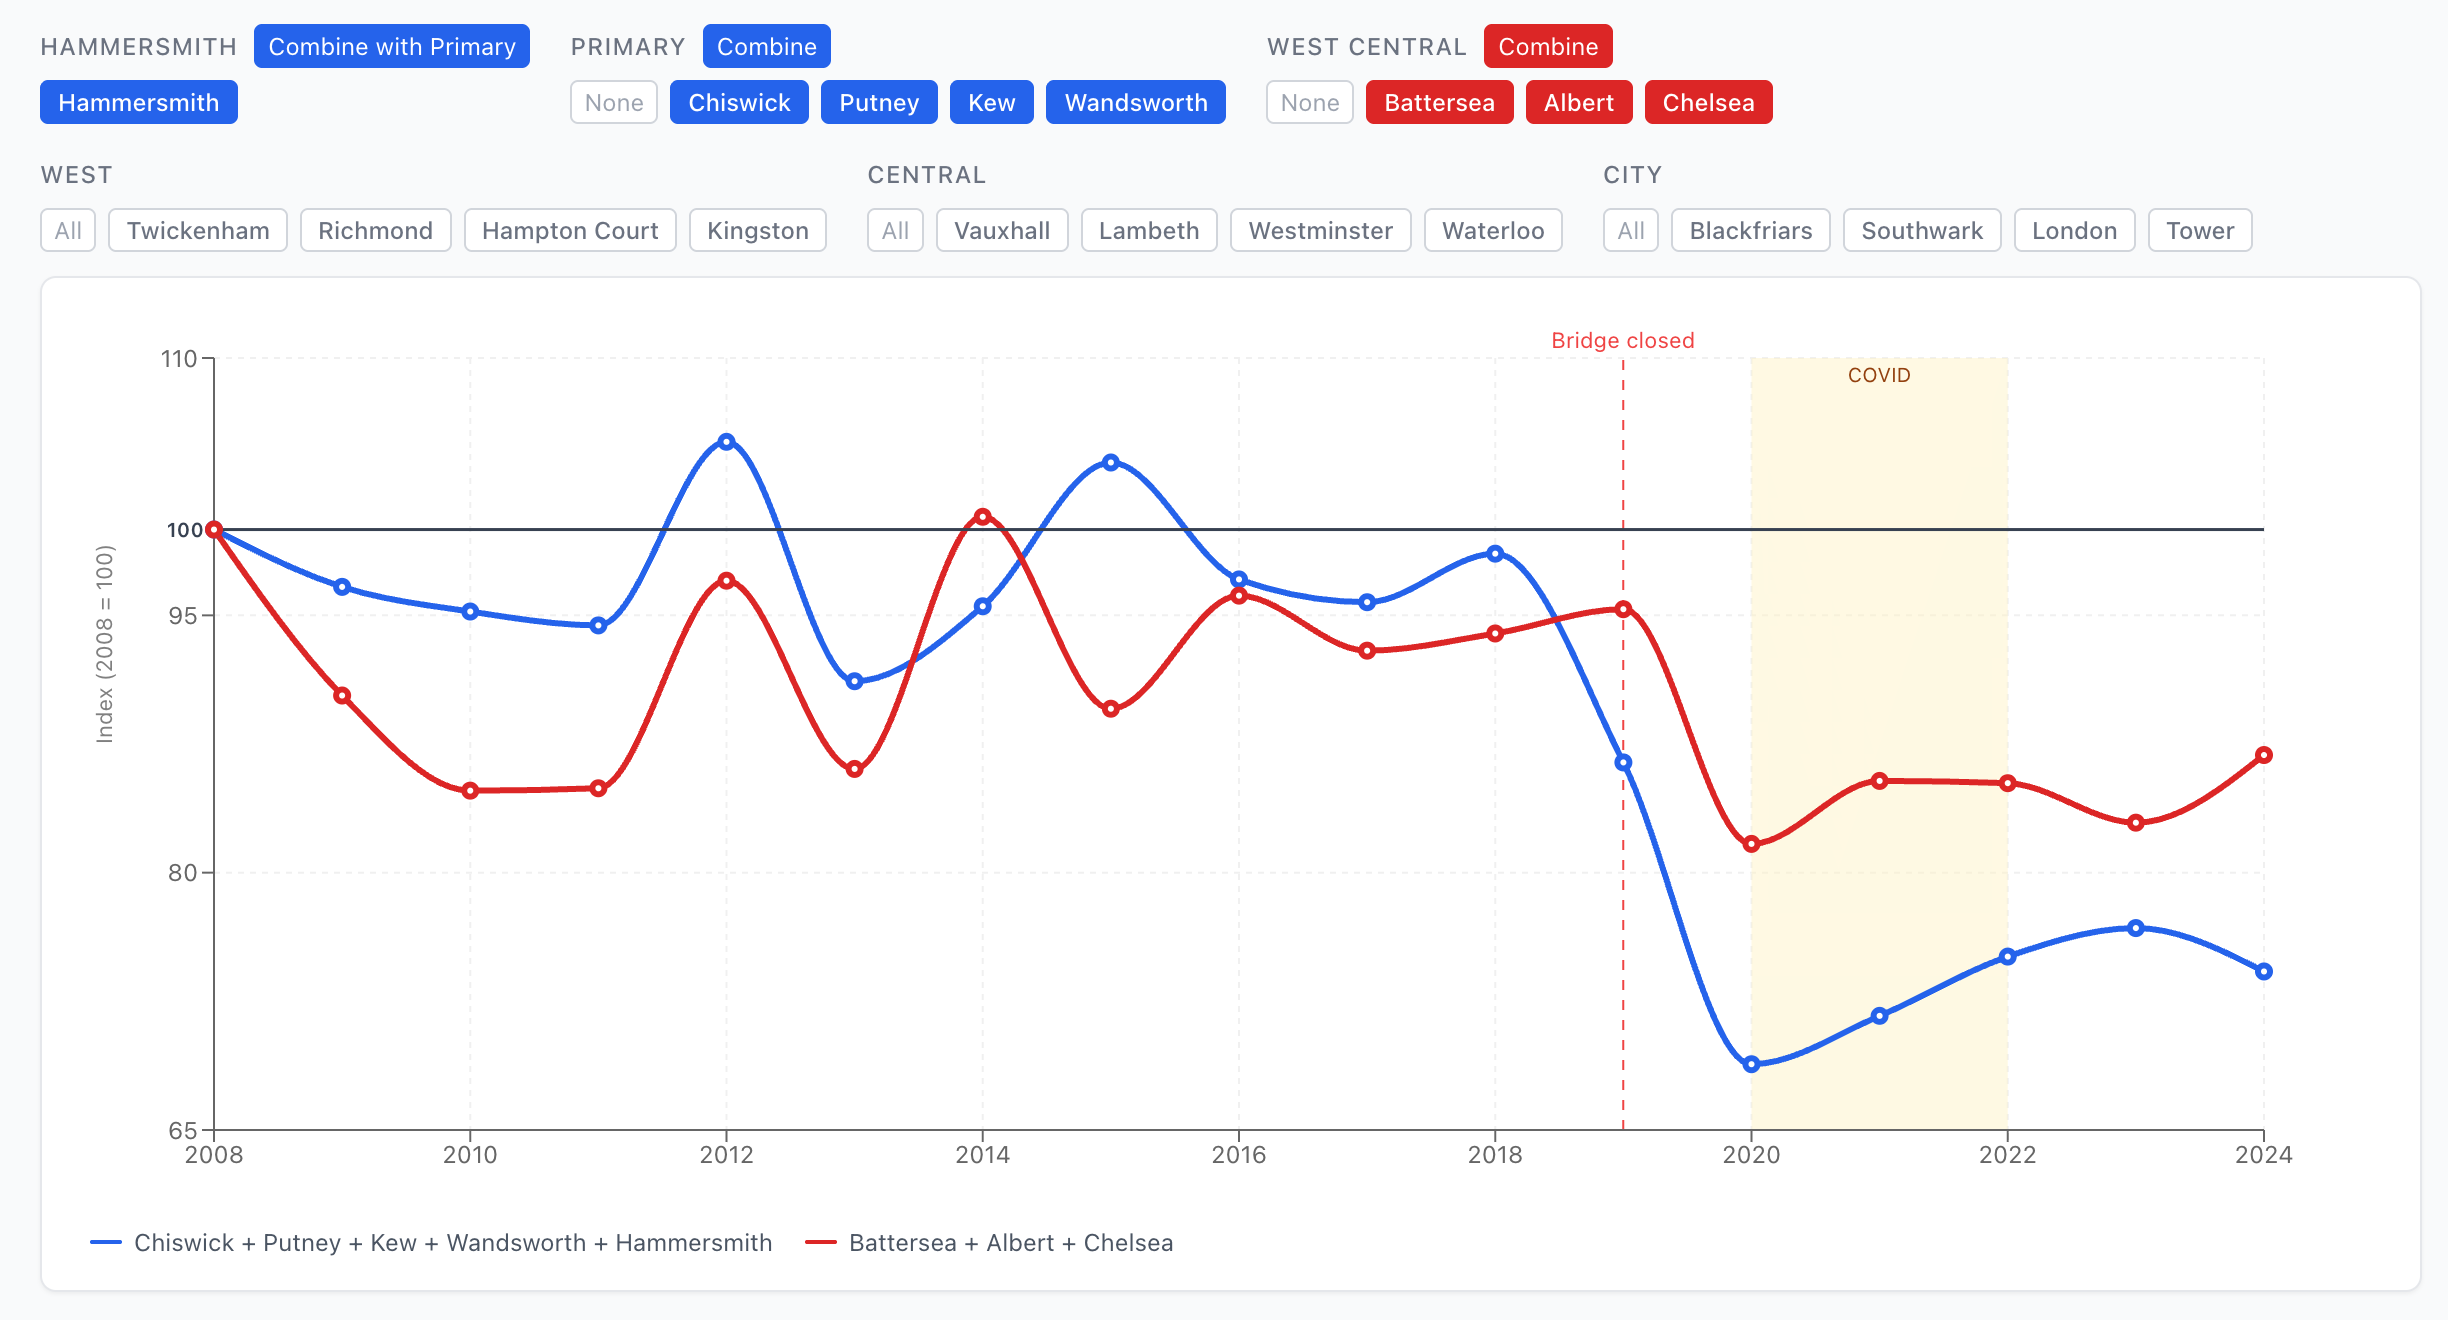
London Bridge Traffic
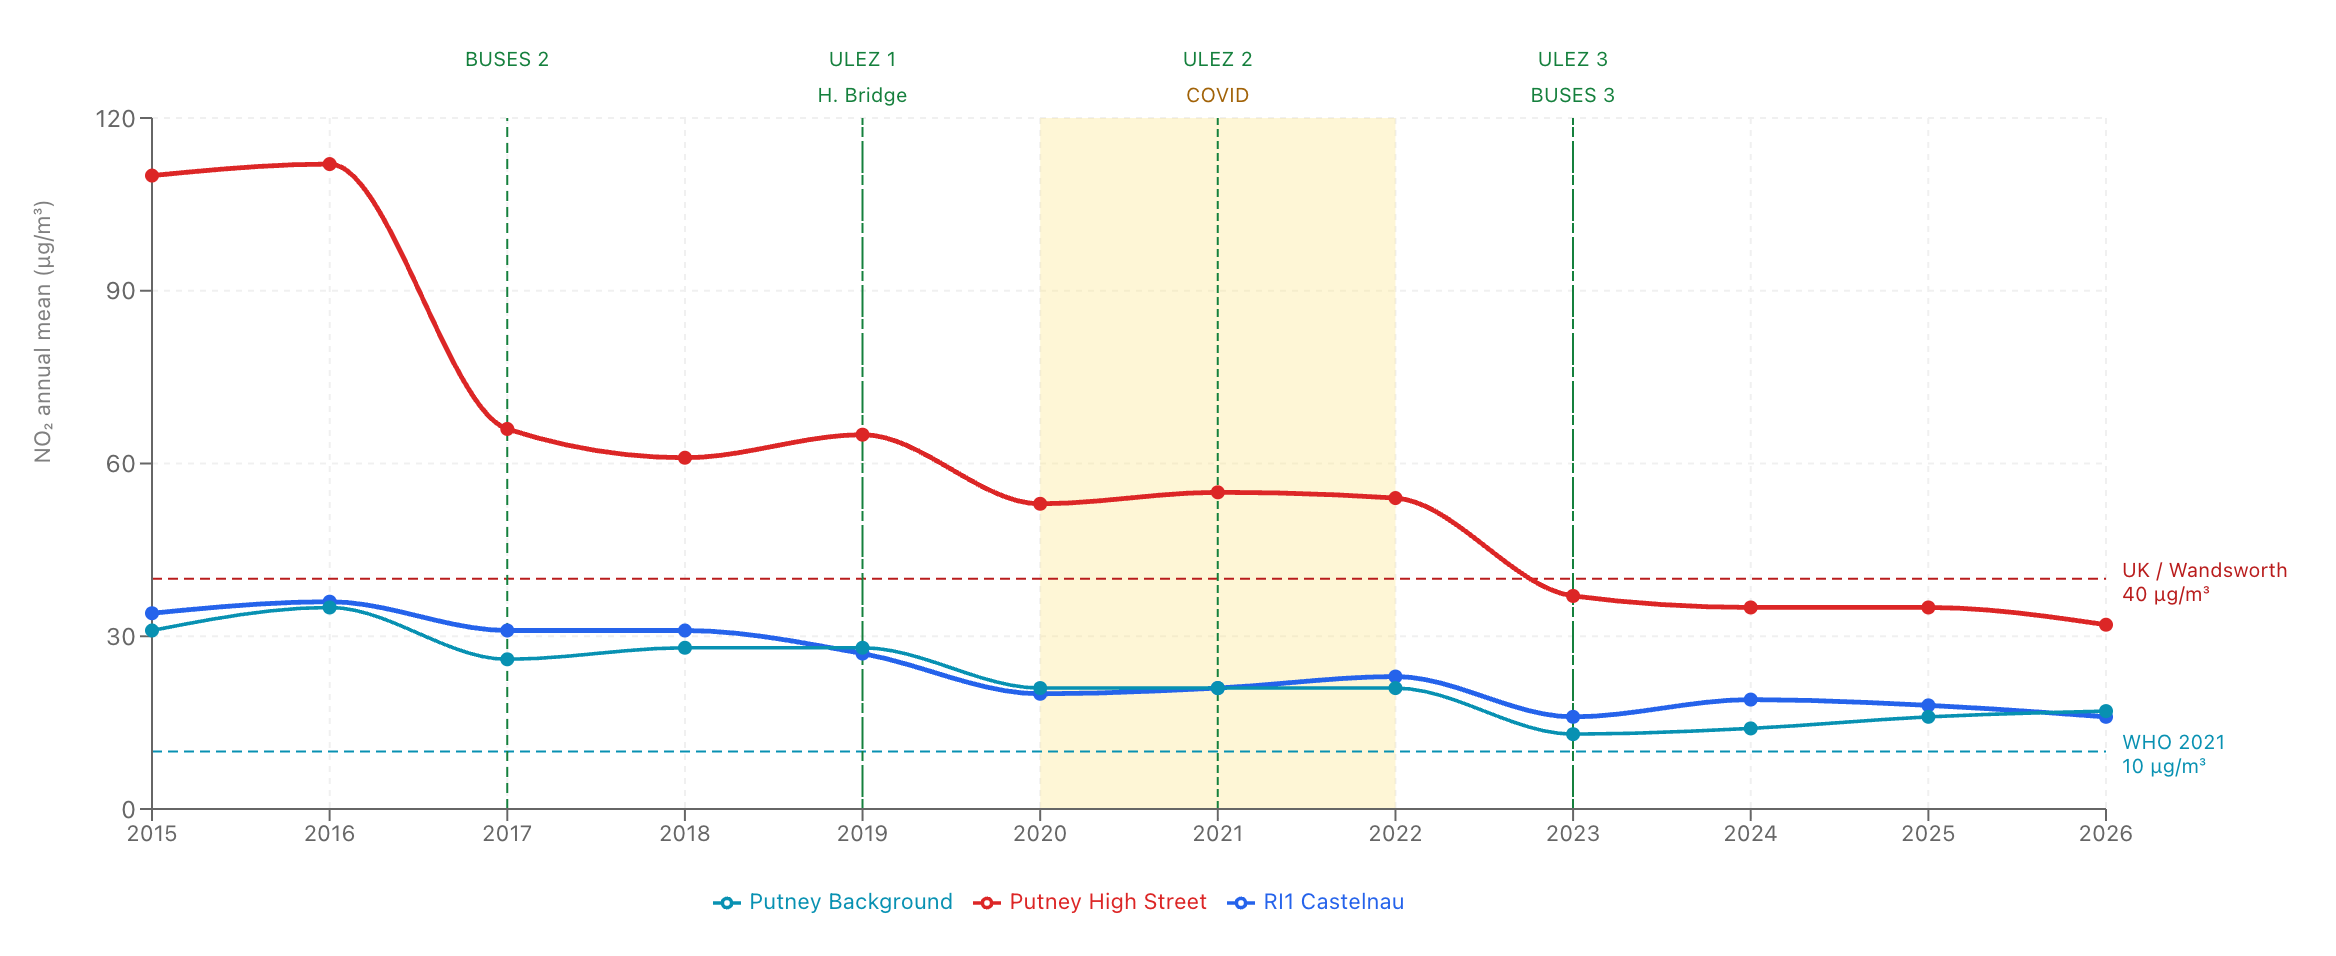
Traffic volumes on every Thames road bridge from Hampton Court to Tower Bridge, before and after Hammersmith Bridge closed to motor traffic in April 2019. Includes a separate Putney air quality view that tracks NO₂ at the kerbside, the diffusion-tube on the high street, and background sites in Putney and Barnes, with markers for the interventions that plausibly changed it (TfL bus upgrades 2013 and 2023, the 2017 Low Emission Bus Zone, ULEZ Central / Inner / London-wide).
- Sources
- DfT Road Traffic Statistics (AADF, 2000 to 2024); TfL Thames Screenline (FOI 4078 2425, FOI 3707 2425); London Air Quality Network (King's College London and Imperial), annual statistics 2010 to 2026; Wandsworth Council Annual Air Quality Status Reports (2021 and 2024).
- Live data
- LAQN annual statistics are pulled directly from the King's College API and refreshed daily. DfT AADF is checked daily; new years import as soon as they publish (usually June).
Open the dashboard